Scientific Graph Plotting for Publication
Original price was: $10.0.$5.0Current price is: $5.0.
Description
Scientific Graph Plotting for Publication
Presenting your scientific results clearly is just as important as the experiments themselves. Whether your data comes from spectroscopy, microscopy, material characterization, or any analytical technique, InstaNANO helps you transform raw values into professional, publication-quality graphs.
If you are unsure how to plot your results, which graph style is best, or how to format your figures for journals — don’t worry. Our expert team will create visually appealing, scientifically accurate, and journal-compliant graphs for you.
What We Can Plot for You
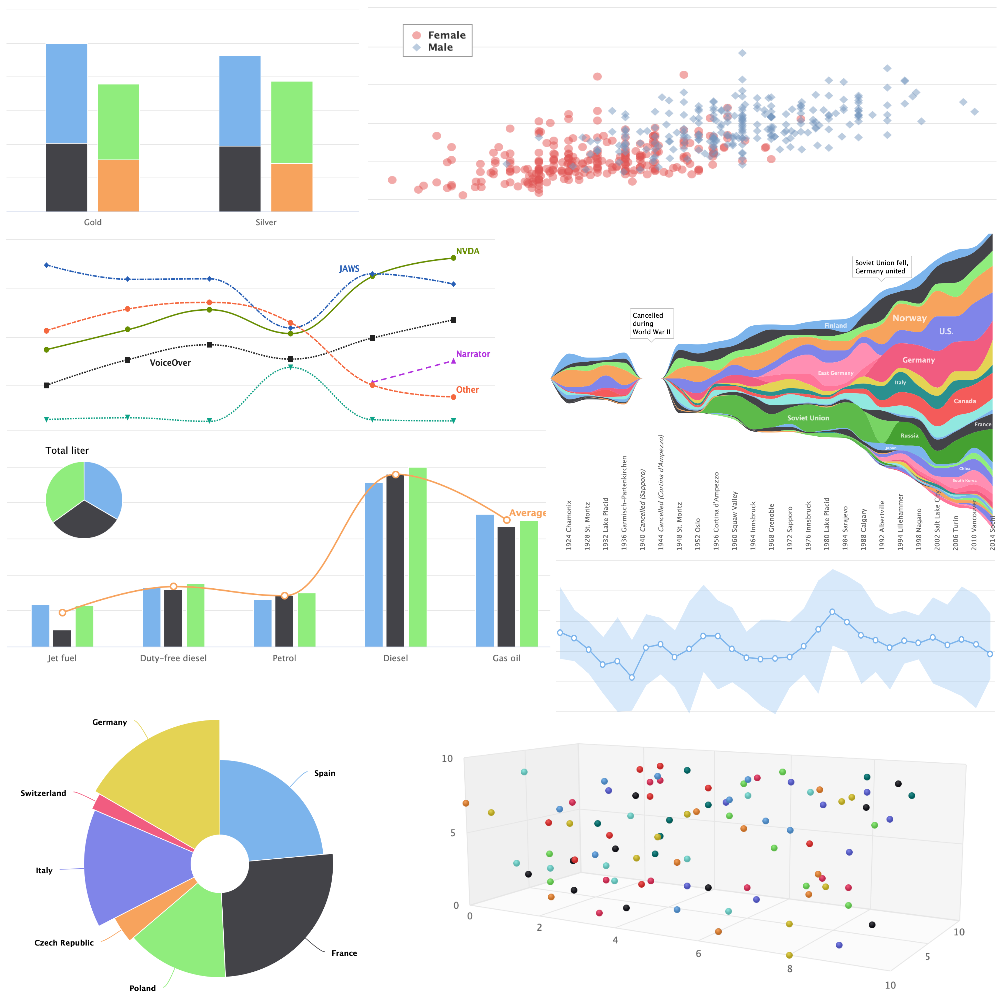
We provide all major 2D and 3D scientific plotting formats, including:
2D Scientific Graphs
- Simple X–Y axis plots
- Graphs with error bars
- Multi-series plots
- Bar charts
- Line + scatter combinations
- Multi Y-axis graphs
- Peak-fitted graphs (for spectroscopy data)
3D Scientific Visualizations
- 3D X–Y–Z surface plots
- 3D colormap/heatmap graphs
- 3D scatter plots
- Contour maps
Other Specialized Plots
- 2D/3D pie charts
- Statistical plots
- Comparative overlay graphs
- Customized graphs based on journal requirements
If your graph type is not listed, we can create any custom plot as per your needs.
What You Will Receive
- High-resolution, professionally formatted graphs suitable for international journals, conferences, and books.
- Graphs consistent with scientific standards, including clear axis labels, legends, proper scales, and color schemes.
- Figures that meet publication guidelines of major publishers (Elsevier, Springer, ACS, Wiley, Nature, Taylor & Francis, etc.).
Why Choose InstaNANO
- Expert Scientific Plotting: Graphs are created by researchers experienced in spectroscopy, microscopy, nanotechnology, materials science, and data visualization - ensuring accuracy and clarity.
- Publication-Ready Output: Figures follow international journal standards:
- Proper resolution (300–600 DPI)
- Correct formatting
- Clear labels, legends, and annotations
- Clean visual design preferred by reviewers and editors
- Trusted by Researchers Worldwide: InstaNANO is used by students, researchers, laboratories, and industries across the globe. Our results have been included in research papers, theses, books, patents, and industrial reports, reflecting our credibility and accuracy. See how our is cited: https://instanano.com/citations/
- Compatible With All Software: You receive outputs that can be used anywhere in Excel, PowerPoint, Origin, Python, MATLAB, Illustrator, GraphPad, Canva, and more.
- Fast Turnaround: Get your graphs quickly so you can meet research paper deadlines or thesis submission timelines.
- Hassle-Free Online Process: Just upload your data, relax, and receive perfectly plotted graphs without worrying about formatting or technical details.
- Lifetime Storage: All your plotted figures remain available in your InstaNANO account - download whenever you need them.
Related products
-
Sale!

Custom Image Calculations
Original price was: $100.0.$29.0Current price is: $29.0. Add to cart -
Sale!
TGA Instrument Sample Run Service
Original price was: $40.0.$20.0Current price is: $20.0. Add to cart -
Sale!

XRD Data Matching
Original price was: $100.0.$24.0Current price is: $24.0. Add to cart -
Sale!

SEM Sample Analysis
Original price was: $30.0.$12.0Current price is: $12.0. Add to cart